周末闲来无事,想做点东西,于是就有了这个想法,把现在的疫情数据做可视化处理,然后说干就干了,哈哈!怎么做呢?第一步,数据准备;第二步,数据处理及可视化。
一 . 数据准备
这块需要的数据我是用Python写的爬虫采集网上的数据,网易,腾讯,新浪等这几个门户网站都有关于新冠肺炎疫情的专题页面,里面有很多疫情数据,留意这些数据哪个是自己需要的就行了。
然后,国内的疫情数据我是在网易那边采集的,境外的数据从腾讯那边采集的,这些数据存到csv文件里备用。废话不多说,上代码
import requests
import json
import csv
import time

# 国内和国外数据放在一起

# 国内数据
now_time = int(round(time.time() * 1000))
url = 'https://c.m.163.com/ug/api/wuhan/app/data/list-total?t=' + str(now_time)
headers = {
'user-agent': 'Mozilla/5.0 (Linux; Android 6.0; Nexus 5 Build/MRA58N) AppleWebKit/537.36 (KHTML, like Gecko) Chrome/72.0.3626.81 Mobile Safari/537.36',
}
resp = requests.get(url, headers=headers)
data = json.loads(resp.content.decode())

# 每天的列表数据  国家 日期 累计确诊,现有确诊,当日新增,累计死亡,累计治愈
csv_data = []
for row in data['data']['chinaDayList']:
    left_confirm = row['total']['confirm'] - row['total']['heal'] - row['total']['dead']
    csv_data.append(['中国',row['date'], row['total']['confirm'], left_confirm, row['today']['confirm'], row['total']['dead'],row['total']['heal']])

# 获取当天的数据
now_time = float(now_time/1000)
timeArray = time.localtime(now_time)
today = time.strftime("%Y-%m-%d", timeArray)
today_data = data['data']['chinaTotal']
left_confirm = today_data['total']['confirm'] - today_data['total']['heal'] - today_data['total']['dead']
csv_data.append(['中国',today, today_data['total']['confirm'],left_confirm,today_data['today']['confirm'],today_data['total']['dead'],today_data['total']['heal']])


# 国外数据
country_url = 'https://api.inews.qq.com/newsqa/v1/automation/foreign/country/ranklist'
headers = {
'user-agent': 'Mozilla/5.0 (Linux; Android 6.0; Nexus 5 Build/MRA58N) AppleWebKit/537.36 (KHTML, like Gecko) Chrome/72.0.3626.81 Mobile Safari/537.36',
}
resp = requests.get(country_url, headers=headers)
data = json.loads(resp.content.decode())
country_list = []
for k in data['data']:
    country_list.append(k['name'])

#print(country_list)
for country in country_list:
    try:
        new_url = 'https://api.inews.qq.com/newsqa/v1/automation/foreign/daily/list?country=' + country
        new_resp = requests.get(new_url, headers=headers)
        new_data = json.loads(new_resp.content.decode())

        #国家 日期 累计确诊,现有确诊,当日新增,累计死亡,累计治愈
        for row in new_data['data']:
            date = '2020/' + row['date'].replace('.', '/')
            now_confirm = row['confirm'] - row['heal'] - row['dead']
            csv_data.append([country, date, row['confirm'], now_confirm, row['confirm_add'], row['dead'], row['heal']])
    except:
        print(country)


# 写入文件
f = open('./all_world_data.csv', 'w', encoding='utf-8' ,newline='')
csv_writer = csv.writer(f)
csv_writer.writerow(['国家','日期','累计确诊','现有确诊','当天新增','累计死亡','累计治愈'])
csv_writer.writerows(csv_data)
f.close()
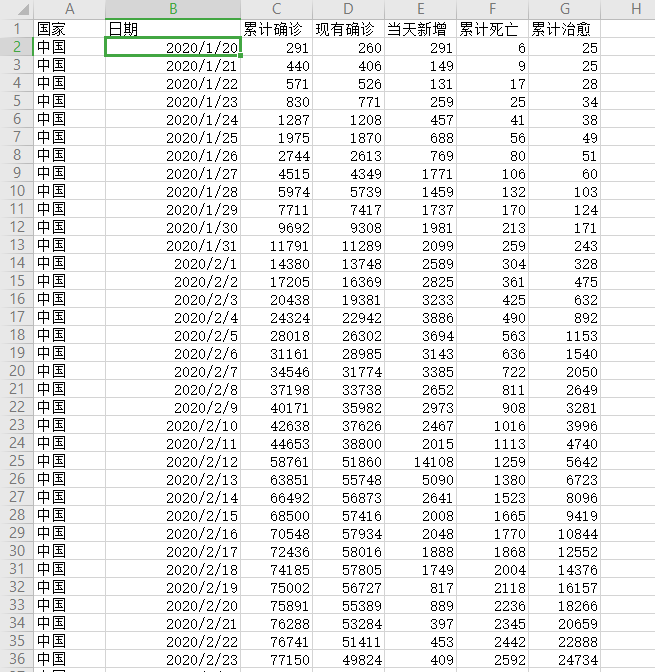
生成的csv文件,大致如下所示

二. 数据可视化
上一步拿到数据后,可能还需要做一些手动勘误,这个自己简单看下,有没有爬虫抓到明显有误的数据。
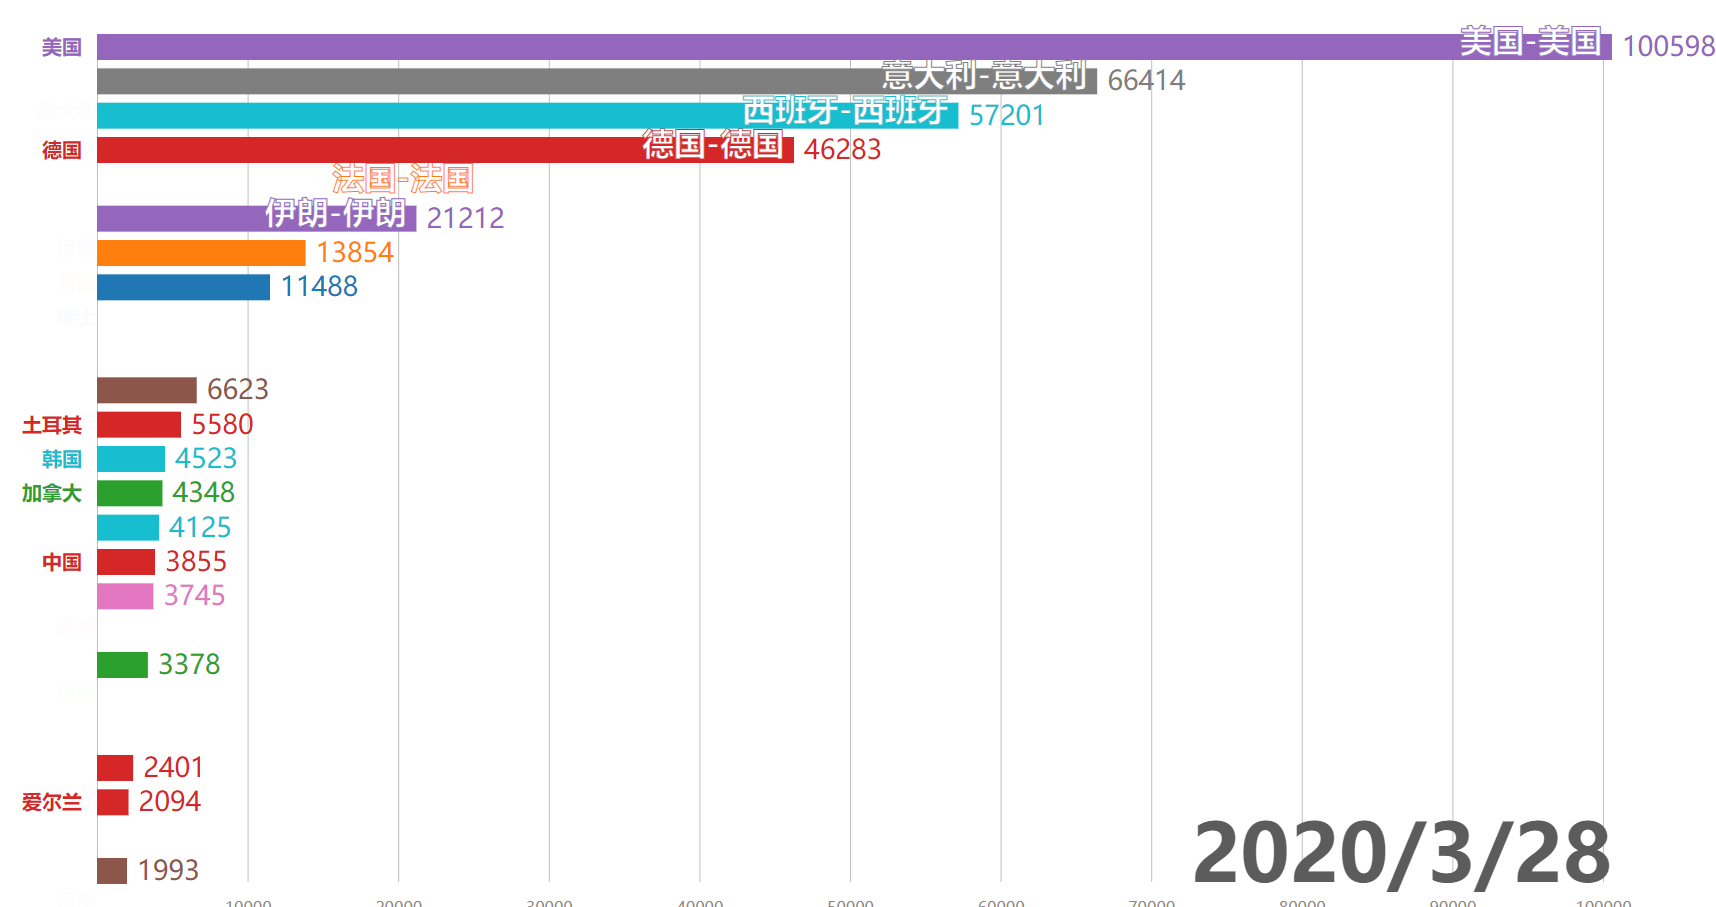
具体的数据可视化我用的是基于 d3.js 的一个开源组件,这个组件会动态的把数据可视化,如下图,

我这边把这个过程用录屏工具录制成视频,然后再对视频做了进一步的处理。
视频在这: 一个视频带你了解截止到2020年3月28日的全球新冠疫情动态